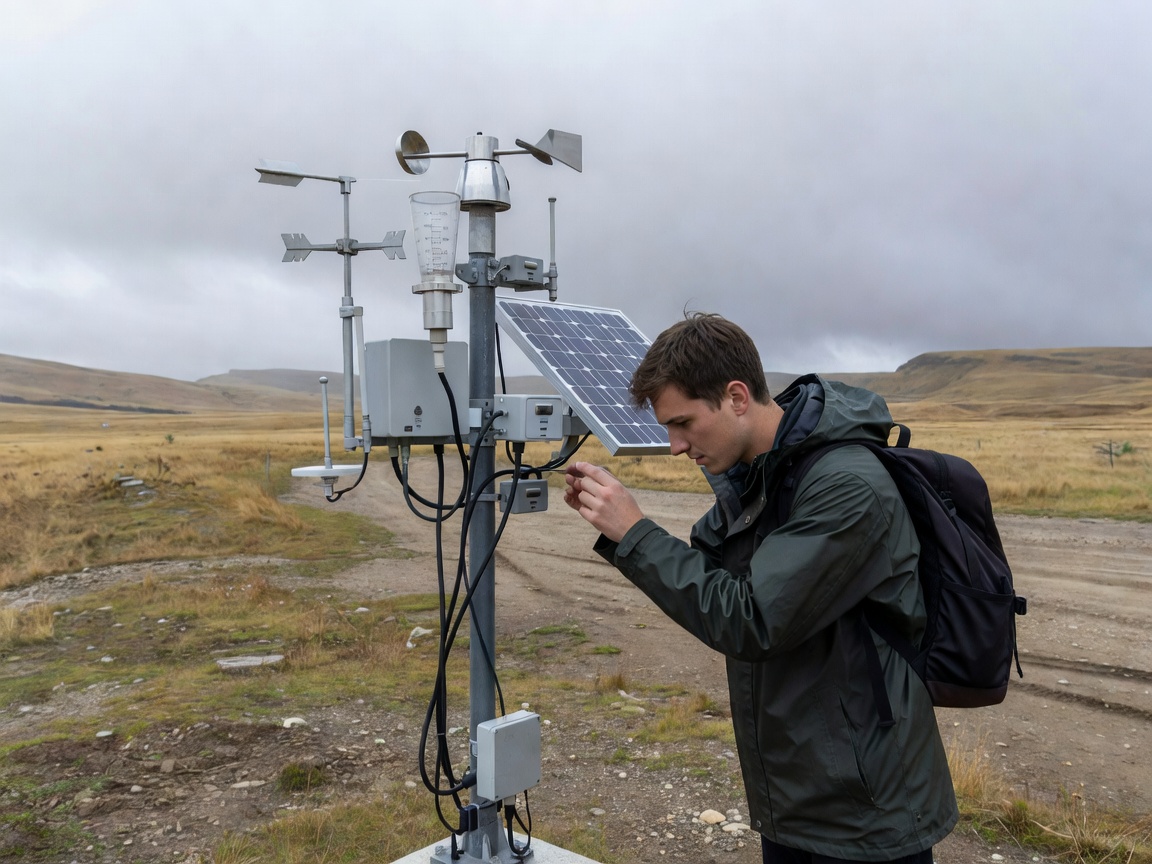
Monitoring exhibits translate technical systems into public information. A weather instrument can demonstrate air movement. A water display can show sampling locations and changing conditions. A glacier model can connect a physical landscape to repeated observation. The purpose is not to make a complex system look simple. It is to make its structure understandable.
From instrument to explanation
Weather instruments record variables such as temperature, pressure, wind or precipitation. Air-quality displays may explain particles and gases without suggesting that one reading describes an entire region. Water observation can include flow, level, chemistry or biological indicators. Each measurement has a location, unit, method and period.
Glacier monitoring often combines field observations, images, elevation information and remote sensing. Biodiversity observation may use repeat visits, acoustic records, photographs or species surveys. These approaches answer different questions. A display should identify the difference between a direct observation and an interpretation built from several sources.
Sensor systems and field stations
Field stations are useful teaching tools because they reveal maintenance and context. Sensors need placement, calibration, power and protection from interference. A visitor does not need a technical manual, but should understand that the instrument is part of a larger system. The data path may include collection, quality checks, storage and analysis.
Satellite data in public displays
Satellite imagery is not a photograph of every environmental process. It is a measurement or derived product captured through a defined sensing method. Exhibits can explain scale, repeat coverage and processing. They should state when an image is raw, classified, combined or interpreted.
Useful questions to ask
- What is being measured?
- Where is the observation made?
- What time period does it represent?
- What is the margin of uncertainty?
- Which part is measured and which part is interpreted?
Good for
Monitoring exhibits suit visitors who learn through objects, diagrams and live demonstrations. They are useful for school groups, families and anyone comparing local conditions with wider environmental records.
What to know
Displays may use historical, simulated or illustrative material. Read the labels carefully. Confirm current opening arrangements, demonstrations and accessibility with the destination’s official source.
Related guides
Continue with climate data and visualization, compare settings through European climate regions, or use the visit planning guide.