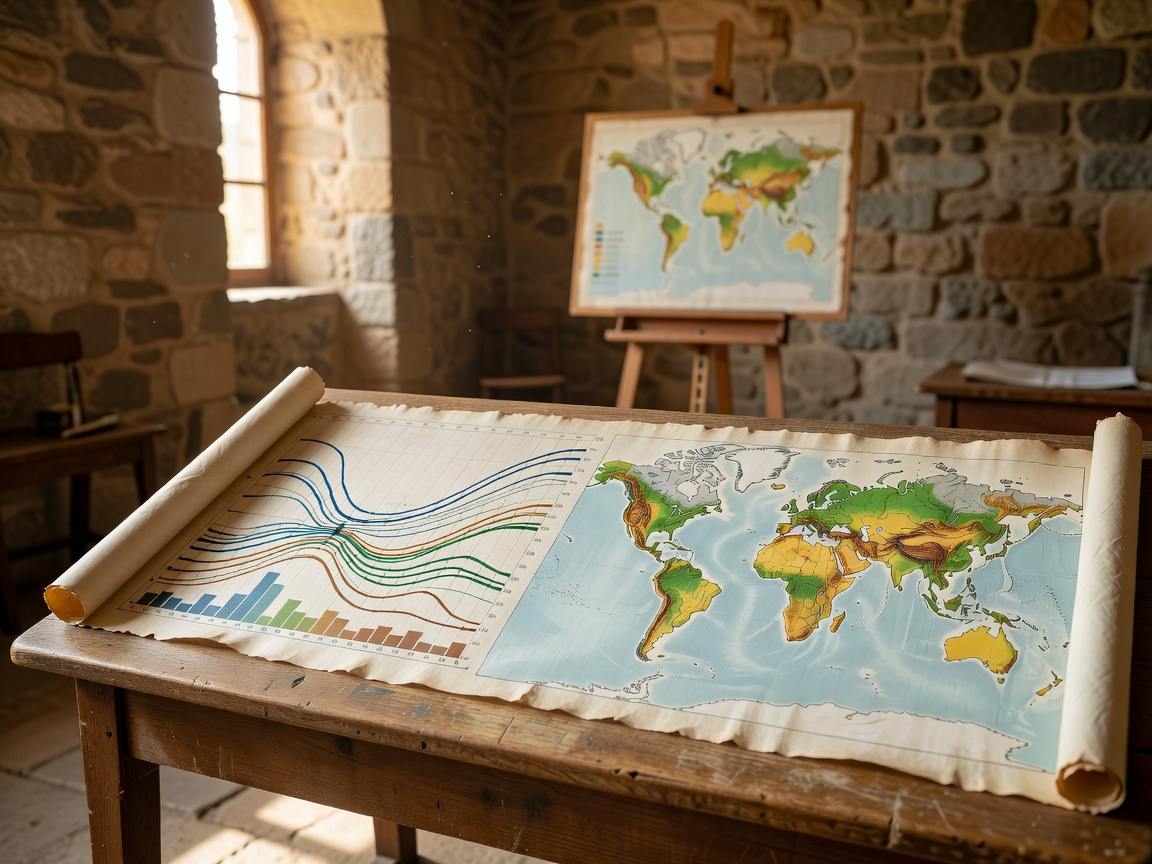
Climate data is not one object. It includes observations, measurements, processed records, model output, projections and human interpretation. A clear exhibit identifies which type is being shown. It avoids presenting a chart as if it were a direct view of the whole climate system.
Five terms to separate
Observation
A recorded occurrence or condition at a place and time.
Measurement
A quantified observation made with a defined method or instrument.
Model output
A calculated result produced by a representation of a system.
Projection
A conditional estimate based on assumptions about future conditions.
Interpretation
An explanation that connects evidence, context and meaning.
Reading common displays
Temperature records need a location, reference period and method. Precipitation records depend on collection methods and local exposure. Atmospheric measurements may describe pressure, composition, motion or energy. A time-series chart shows change across an interval; it does not automatically explain the cause of every movement.
Maps compress geography. Check the legend, scale, colour range and unit. A smooth surface may be interpolated between observation points. A point map may show where measurements exist, not where a condition is absent. Good public visualization makes these choices visible.
Models and observation networks
Observation networks provide evidence from instruments and field locations. Models combine equations, assumptions and available data to represent processes or estimate conditions where direct observation is limited. Different models can produce different outputs because their structure, inputs and resolution differ.
Uncertainty is information
Uncertainty can arise from instrument limits, missing records, sampling, processing choices or model assumptions. It does not mean that a record is useless. It tells the reader how confidently a result should be used and what further evidence may matter.
Good for
- Visitors comparing maps and time series.
- Students learning evidence categories.
- Readers checking claims made from charts.
What to know
Use the source notes on every display. Confirm whether a graphic is historical, current, simulated or projected. Climate information can be updated as methods and records improve.
Related guides
See monitoring exhibits for instruments and research centers for observation settings. Plan access with the visit guide.